


I Used ChatGPT To Code Quantamental Value's Screener Backtest Against The S&P 500
And it is addictive!

I never coded before, but the experience was very enjoyable. I do see myself putting some time into learning coding, as long as I find a some niche or useful application for it.
I paid $8.99 for a week’s subscription to Genie’s ChatGPT, I asked it the following: “Write a code that backtests an equal-weighted portfolio of stocks within a specified period, with the stock list taken from an excel sheet using a specified path, and compare it against the S&P 500, using yahoo finance, rebase the results into 100, then plot the results.”
I believe the code was almost correct, but there were some small issues that took me almost three hours to fix (given my limited knowledge).
Here is the result on the backtest (without rebalancing, given the difficulty of the code… at least for me):
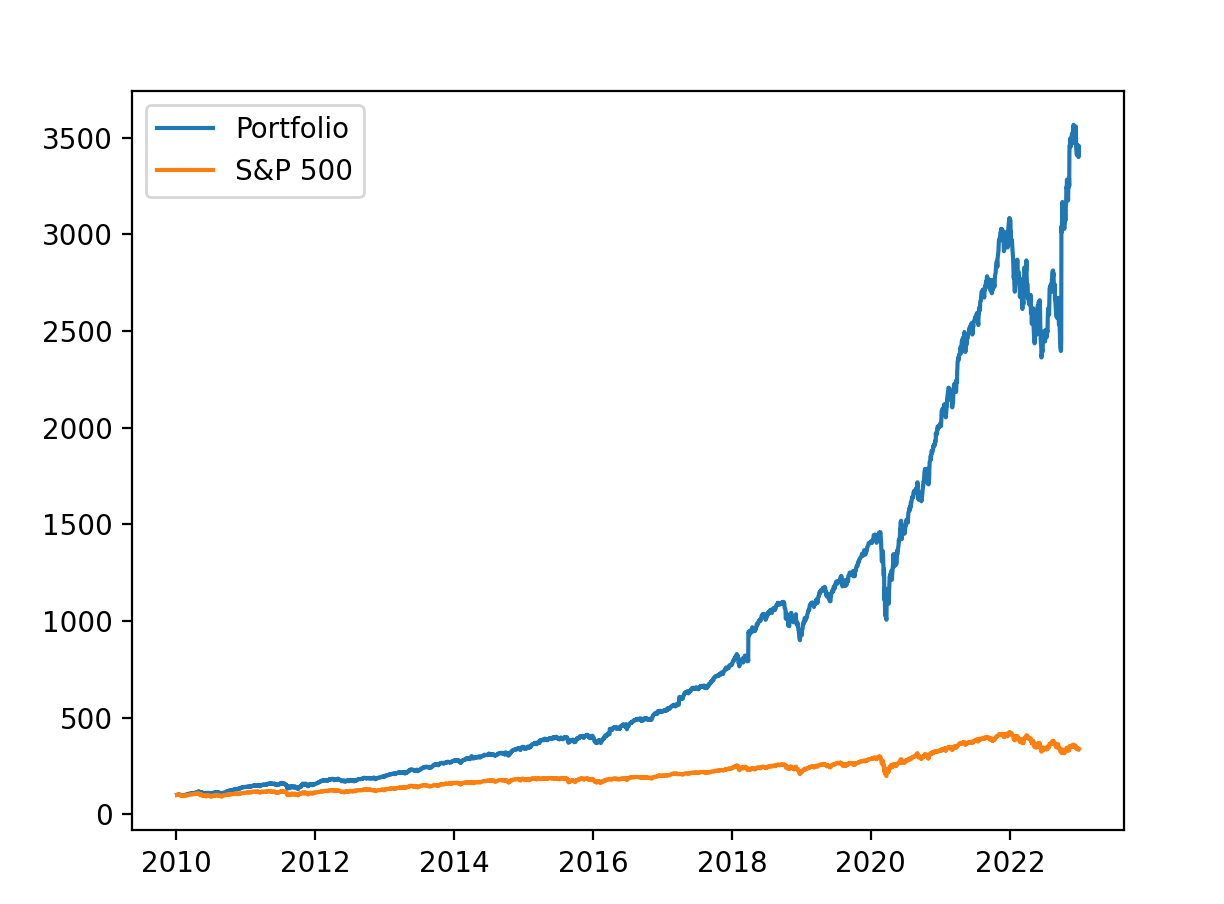
Although it does not have a rebalancing factor, you can look at it as if you have a holding period of “forever”, as Warren Buffett highlighted, which is also in line with what we do…
For your reference and indulgence, I share the final code:
import yfinance as yfimport pandas as pdimport matplotlib.pyplot as plt# Specify the stocksdf = pd.read_excel('/Users/naifgsoufi/Downloads/backteststocks.xlsx')# Create a list of stocks from the Excel filestocks = df['Stock'].tolist()# Specify the datesstart_date = '2010-01-01'end_date = '2022-12-31'# Get the datadata = yf.download(stocks, start=start_date, end=end_date)# Calculate the portfolio returnsportfolio_returns = data['Adj Close'].pct_change().mean(axis=1)# Calculate the S&P500 returnssp500_returns = yf.download('^GSPC', start=start_date, end=end_date)['Adj Close'].pct_change()# Rebase the portfolio returns to 100portfolio_returns_rebased = (portfolio_returns + 1).cumprod() * 100# Rebase the S&P500 returns to 100sp500_returns_rebased = (sp500_returns + 1).cumprod() * 100# Print the portfolio returns to 100print(portfolio_returns_rebased)# Print the S&P 500 returns to 100print(sp500_returns_rebased)# Plot the returnsplt.plot(portfolio_returns_rebased, label='Portfolio')plt.plot(sp500_returns_rebased, label='S&P 500')plt.legend()plt.show()Hope you enjoyed this short and interesting article!