Gross Vs. Net ROIC: Is A Company Really Creating Value Or Not?
Mitigate accounting gimmicks and get to the bottom of the problem by understanding the key differences between Gross and Net ROIC
Accounting practices are known to skew financial metrics and impair comparability across firms, from the expensing of investments like R&D and S&M in the income statement to the different ways for calculating depreciation expenses.
What we really want to do is analyze how much return was REALLY generated from each dollar reinvested in the business.
It is important, and would be ideal, to differentiate between maintenance investments and growth investments, but unfortunately those are usually not available and rarely provided in the notes to the financial statements. It would have really eased our analysis and removed any guesswork from our assessment. For our purposes, we will assume all investments are growth investments.
Overview:
If a company makes one dollar net before any investments and invests that one dollar at a return of 20%, its free cash flow would be zero that year, and that’s not necessarily a bad thing since it will have 1.2 dollars to invest the next year, and so the compounding continues. This is better than distributing the one dollar that year, and getting the same dollar the next year.
So the value creation story lies in two metrics:
Gross Cash Flows (GCF): cashflows available before making any investments in R&D, S&M, working capital, Capex and acquisitions, etc.
Free Cash Flows (FCF): cash flows remaining after making all investments
The difference between these two is the reinvestment or retained amount.
Hypothetical Example:
If a company starts with a GCF of 250 and fully reinvests its cash flows, it will have an FCF of zero, but GCF will continue to compound - on the other hand, if a company decides not to reinvest anything, it will have a FCF of 250 (GCF=FCF) available for distribution.
As long as ROIC>WACC, do not penalize a company for not having or having low free cash flows because of its heavy reinvestment rate. Look at GCF to understand the full picture.
Amazon as an example:
From 2003 to 2021, Amazon has generated cumulative gross cash flows of $549.5 Bn, of which it reinvested $524.5 Bn (96% cumulative reinvestment rate) mainly in the form of Capex, R&D, S&M and Acquisitions.
Although FCF margin averaged around 4%, it is artificially low due to its heavy reinvestments, which turned out to be shrewd capital allocation decisions as we will see shortly. As the company matures and its reinvestment opportunities diminish, FCF would naturally rise and stabilize into a more normalized FCF margin (Normalized FCF = GCF less maintenance investments).
Was the return on those investments satisfactory?
Depends on where you look.
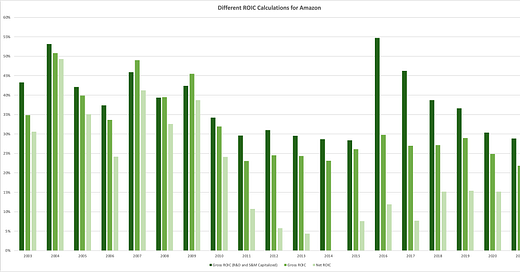
For reasons mentioned earlier, I prefer to look at Gross ROIC with capitalized expenses or Gross ROIC, which just uses gross PP&E.
Net ROIC is not looking healthy, but then again it is mainly due to heavy reinvestments that is negatively impacting the P&L like R&D, S&M and depreciation expenses.
Stripping out these investments and putting them into the denominator and changing the numerator to GCF paints a totally different picture of pure value creation.
On a gross level, the incremental return on invested capital (RONIC) that Amazon generated from 2003-2021 was 29%, versus a meager and untrue 11% when looked at a net level.
In the long run, a stock should appreciate in a similar manner to the intrinsic value a company has created; interestingly enough, the company has compounded shareholder capital at 31% during the same period, much closer to Gross RONIC (29%) than Net RONIC, which I believe is the right way to assess value creation.
Appendix:
Key Takeaways:
Assess GCF and FCF collectively to understand the reinvestment stories, rates and opportunities
Don’t penalize a company for heavily reinvesting in the future at profitable rates; so, reasonably negative or zero FCF is not necessarily a bad thing and could actually be much better than positive FCF companies
Value created from retained cashflows far exceeds current cash flows, assuming RONIC>WACC
Look at Gross ROIC and RONIC, not Net
Source: TIKR, Quantamental Value Analysis


